Wednesday, July 28, 2010
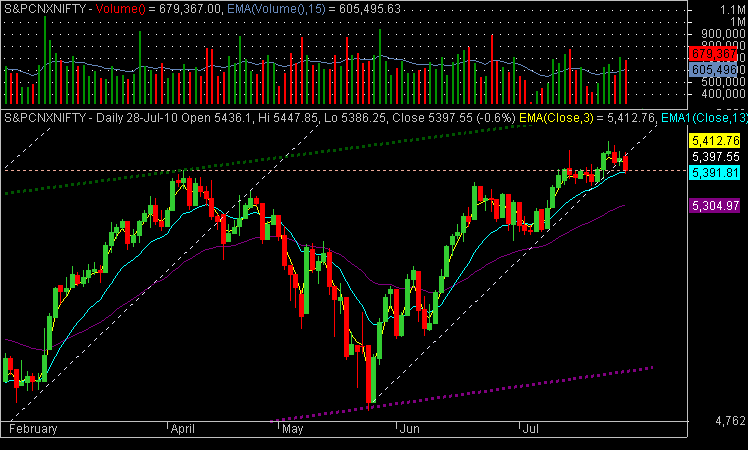
NIFTY EOD Analysis as on 28th July 2010
Red Candle with good volumes showing selling pressure. The Candle pattern looks like Bearish Engulfing. Is this a sign of reversal? Let's see.
The close was also below the pivot pivot line, but closed above the support line. If this support line is broken, then we may see lower levels.
EMA3 is above EMA13 (+).
Slope of EMA 13 is up.(+) EMA 13 is at 5391 level.
EMA13>EMA39.(+)
Answers for Yesterday
Today's Bearish Signals:
1) First an evening star kind of pattern was formed 2 days back.
2) Bearish Engulfing today with good volumes.
3) Stochastic -ve divergence
4) MACD -ve divergence.
NIFTY made a bearish engulfing pattern with good volumes today. The close was at the support line. If tomorow NIFTY falls below this line, then we may head downwards.
Questions
Can bears break the support line?
Let's wait and watch.
The close was also below the pivot pivot line, but closed above the support line. If this support line is broken, then we may see lower levels.
EMA3 is above EMA13 (+).
Slope of EMA 13 is up.(+) EMA 13 is at 5391 level.
EMA13>EMA39.(+)
Answers for Yesterday
Today's Bearish Signals:
1) First an evening star kind of pattern was formed 2 days back.
2) Bearish Engulfing today with good volumes.
3) Stochastic -ve divergence
4) MACD -ve divergence.
NIFTY made a bearish engulfing pattern with good volumes today. The close was at the support line. If tomorow NIFTY falls below this line, then we may head downwards.
Questions
Can bears break the support line?
Let's wait and watch.
Tuesday, July 27, 2010
NIFTY EOD Analysis as on 27th July 2010
Today a green candle was formed. Volume was higher than last day showing buying pressure. But, NIFTY is making lower highs since the hanging man candle was made 2 trading-days back. NIFTY is lying in support line now. Either it will move up from here and in case bears jump in we might go down.
EMA3 is above EMA13 (+).
Slope of EMA 13 is up.(+) EMA 13 is at 5390 level.
EMA13>EMA39.(+)
Answers for Yesterday
Today's Bearish Signals:
1) Last 3 candle formation looks like evening star. Previous candle also looked a bit like Hanging Man.
2) Making Lower lows.
Though the previous 3 candle resembled an evening star pattern, we did not get confirmation that this is actually a reversal. A close below the pivot level and the support line is needed.
Questions
What is going to happen next? Let's wait and watch.
EMA3 is above EMA13 (+).
Slope of EMA 13 is up.(+) EMA 13 is at 5390 level.
EMA13>EMA39.(+)
Answers for Yesterday
Today's Bearish Signals:
1) Last 3 candle formation looks like evening star. Previous candle also looked a bit like Hanging Man.
2) Making Lower lows.
Though the previous 3 candle resembled an evening star pattern, we did not get confirmation that this is actually a reversal. A close below the pivot level and the support line is needed.
Questions
What is going to happen next? Let's wait and watch.
Monday, July 26, 2010
NIFTY EOD Analysis as on 26th July 2010
Red Candle with lower volume than yesterday showing selling pressure, but with decreased enthusiasm. IF NIFTY breaks this price pivot line, then it may go down further, OR if NIFTY bounces back from here, then it might go up from here. Let's see what's ahead.
EMA3 is above EMA13 (+).
Slope of EMA 13 is up.(+) EMA 13 is at 5384 level.
EMA13>EMA39.(+)
Answers for Yesterday
Today's Bearish Signals:
1) Last 3 candle formation looks like evening star. Previous candle also looked a bit like Hanging Man.
2) The close was at the price pivot line.
NIFTY today fell from open to start and the close was at the day's low. The close point was also at the pivot level. The last 3 candles resembles an evening star pattern which is bearish in nature. If NIFTY breaks the pivot line, then we may head downwards in coming sessions.
Questions
What is going to happen next? Let's wait and watch.
EMA3 is above EMA13 (+).
Slope of EMA 13 is up.(+) EMA 13 is at 5384 level.
EMA13>EMA39.(+)
Answers for Yesterday
Today's Bearish Signals:
1) Last 3 candle formation looks like evening star. Previous candle also looked a bit like Hanging Man.
2) The close was at the price pivot line.
NIFTY today fell from open to start and the close was at the day's low. The close point was also at the pivot level. The last 3 candles resembles an evening star pattern which is bearish in nature. If NIFTY breaks the pivot line, then we may head downwards in coming sessions.
Questions
What is going to happen next? Let's wait and watch.
Sunday, July 25, 2010
Subscribe to:
Posts (Atom)