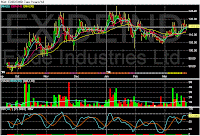
Black Candlestick. Showing selling pressure. Broke the support level at 5235.
Stochastics is -ve bias, and is in overbought area.
MACD is showing flat bias.
EMA5>EMA15>EMA50. EMA5 resistance at 5214. EMA 15 support at 5135.
Answers for Yesterday
NIFTY couldn't stay above 5235 today and closed below that level.
Questions
Can NIFTY sustain above 5150 support level? Let's wait and watch.


