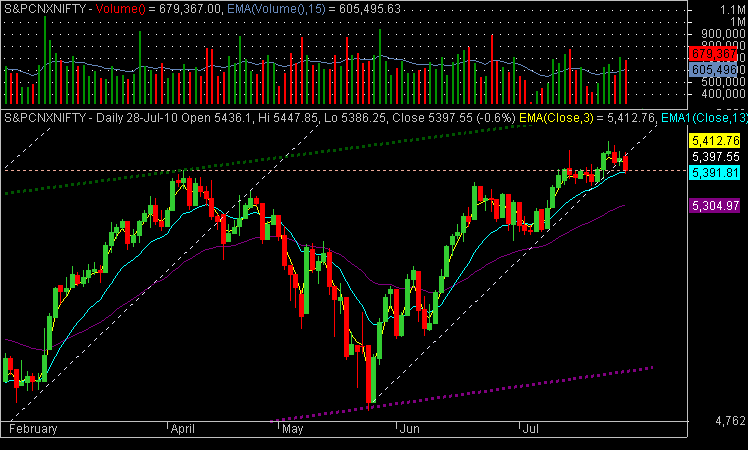
Red Candle with good volumes showing selling pressure. The Candle pattern looks like
Bearish Engulfing. Is this a sign of reversal? Let's see.
The close was also below the pivot pivot line, but closed above the support line. If this support line is broken, then we may see lower levels.
EMA3 is above EMA13 (+).
Slope of EMA 13 is up.(+) EMA 13 is at 5391 level.
EMA13>EMA39.(+)
Answers for Yesterday
Today's Bearish Signals:
1) First an evening star kind of pattern was formed 2 days back.
2) Bearish Engulfing today with good volumes.
3) Stochastic -ve divergence
4) MACD -ve divergence.
NIFTY made a bearish engulfing pattern with good volumes today. The close was at the support line. If tomorow NIFTY falls below this line, then we may head downwards.
Questions
Can bears break the support line?
Let's wait and watch.