
Thursday, May 13, 2010

Wednesday, May 12, 2010


NIFTY EOD Analysis as on 12th May 2010

White candlestick showing buying pressure
MACD is showing flat bias.(~)
Stochastics is showing +ve bias and moving up.(+)
EMA5 is below EMA15 (-). EMA5 support at 5145(+). EMA 15 resistance at 5184(+).
Slope of EMA 5 is up.(+)
Answers for Yesterday
There was normal buying pressure in NIFTY, but found resistance at 5150 level and closed near the resistance level.
Questions
What is going to happen next? Let's wait and watch.

Tuesday, May 11, 2010


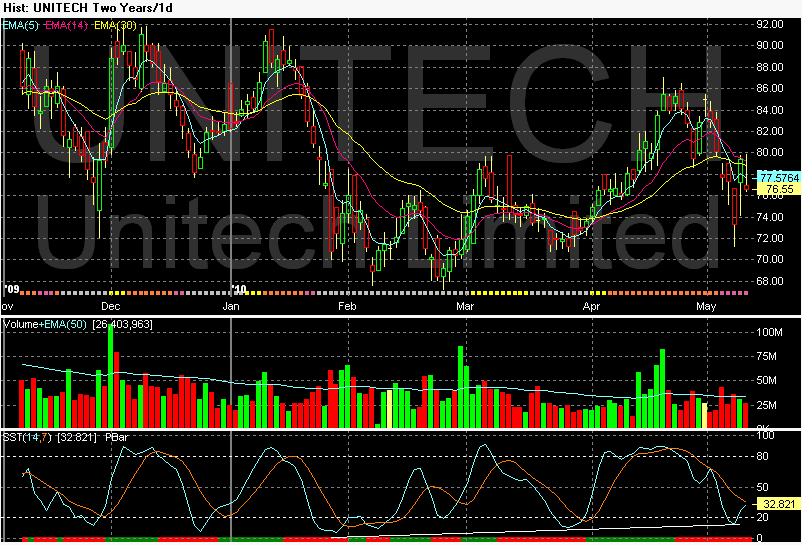

NIFTY EOD Analysis as on 11th May 2010

Black candlestick showing selling pressure
MACD is showing flat bias.(~)(-)
Stochastics is showing +ve bias and moving up.(+)
EMA5 is below EMA15 (-). EMA5 support at 5140(~). EMA 15 resistance at 5190(-).
Slope of EMA 5 is flat.(~)(-)
Answers for Yesterday
Bears again came into action today. NIFTY is mostly being driven on Global cues nowadays.
Questions
What is going to happen next? Let's wait and watch.

Subscribe to:
Posts (Atom)