Friday, July 30, 2010

Interpreting Stocks : 30th July 2010

NIFTY EOD Analysis as on 30th July 2010

Red Candle showing selling pressure. Today, it broke the support line and closed below it. The Close was also below EMA13. Negative bias now in days to come.

EMA3 is below EMA13 (-).
Slope of EMA 13 is flat(~).  EMA 13 is at 5390 level.
EMA13

Answers for Yesterday
Today's Bearish Signals:
1) EMA 3-13 crossdown.
2) Close below support zone.
3) Price making lower low and lower high.
4) Stochastic -ve divergence
5) MACD -ve divergence.

NIFTY closed below the support line today. Also, EMA 3-13 crossdown happened. These things convey that we are going to see bearish bias in coming session.

Questions
What is going to happen next? Let's wait and watch.

Thursday, July 29, 2010

Interpreting Stocks : 29th July 2010

NIFTY EOD Analysis as on 29th July 2010

 Green candle with higher volumes than yesterday at the support level showing demand coming in. Will NIFTY pullback from here? Let's see.

EMA3 is above EMA13 (+).
Slope of EMA 13 is up.(+)  EMA 13 is at 5394 level.
EMA13>EMA39.(+)

Answers for Yesterday
Today's Bearish Signals:
1) Price making lower low and lower high.
2) Stochastic -ve divergence
3) MACD -ve divergence.

NIFTY jumped up a bit today from the support line. Demand comes in at the suppot line. I think we are going to see some sideways movement in next few sessions.

Questions
What is going to happen next? Let's wait and watch.

Wednesday, July 28, 2010

Interpreting Stocks : 28th July 2010

NIFTY EOD Analysis as on 28th July 2010

 Red Candle with good volumes showing selling pressure. The Candle pattern looks like Bearish Engulfing. Is this a sign of reversal? Let's see.
The close was also below the pivot pivot line, but closed above the support line. If this support line is broken, then we may see lower levels.

EMA3 is above EMA13 (+).
Slope of EMA 13 is up.(+)  EMA 13 is at 5391 level.
EMA13>EMA39.(+)

Answers for Yesterday
Today's Bearish Signals:
1) First an evening star kind of pattern was formed 2 days back.
2) Bearish Engulfing today with good volumes.
3) Stochastic -ve divergence
4) MACD -ve divergence.

NIFTY made a bearish engulfing pattern with good volumes today. The close was at the support line. If tomorow NIFTY falls below this line, then we may head downwards.

Questions
Can bears break the support line?
Let's wait and watch.

Tuesday, July 27, 2010

Interpreting Stocks : 27th July 2010

NIFTY EOD Analysis as on 27th July 2010

 Today a green candle was formed. Volume was higher than last day showing buying pressure. But, NIFTY is making lower highs since the hanging man candle was made 2 trading-days back. NIFTY is lying in support line now. Either it will move up from here and in case bears jump in we might go down.

EMA3 is above EMA13 (+).
Slope of EMA 13 is up.(+)  EMA 13 is at 5390 level.
EMA13>EMA39.(+)

Answers for Yesterday
Today's Bearish Signals:
1) Last 3 candle formation looks like evening star. Previous candle also looked a bit like Hanging Man.
2) Making Lower lows.

Though the previous 3 candle resembled an evening star pattern, we did not get confirmation that this is actually a reversal. A close below the pivot level and the support line is needed.

Questions
What is going to happen next? Let's wait and watch.

Monday, July 26, 2010

NIFTY EOD Analysis as on 26th July 2010

Red Candle with lower volume than yesterday showing selling pressure, but with decreased enthusiasm. IF NIFTY breaks this price pivot line, then it may go down further, OR if NIFTY bounces back from here, then it might go up from here. Let's see what's ahead.

EMA3 is above EMA13 (+).
Slope of EMA 13 is up.(+)  EMA 13 is at 5384 level.
EMA13>EMA39.(+)

Answers for Yesterday
Today's Bearish Signals:
1) Last 3 candle formation looks like evening star. Previous candle also looked a bit like Hanging Man.
2) The close was at the price pivot line.

NIFTY today fell from open to start and the close was at the day's low. The close point was also at the pivot level. The last 3 candles resembles an evening star pattern which is bearish in nature. If NIFTY breaks the pivot line, then we may head downwards in coming sessions.

Questions
What is going to happen next? Let's wait and watch.

Friday, July 23, 2010

Interpreting Stocks : 23rd July 2010

NIFTY EOD Analysis as on 23rd July 2010

 Green Candle with small lower shadow and big upper shadow, showing that during the day Bulls were on rampage, but by the end of the day, bears succeeded in pulling the price low and close was below the day's mid point. Volume was higher than yesterday, showing buying pressure.

EMA3 is above EMA13 (+).
Slope of EMA 13 is up.(+)  EMA 13 is at 5378 level
EMA13>EMA39.(+)

Answers for Yesterday
Today's Bearish Signals:
1) Candle looks a bit like Hanging Man, but we need confirmation to be sure.

NIFTY rightly moved forward today, after making the pivot low 2 days back. Volume also supported the upmove. The candle of today looks a bit like Hanging Man. But, we need confirmation to be sure. So, let see what's in store next.

Questions
What is going to happen next? Let's wait and watch.

Thursday, July 22, 2010

Interpreting Stocks : 22nd July 2010

NIFTY EOD Analysis as on 22nd July 2010

 Green Candle with good and higher volumes than yesterday, showing buying pressure. Today, it crossed the 5400 level and closed above it.  Positive days ahead? Let's see. We should move up from here now

EMA3 is above EMA13 (+).
Slope of EMA 13 is up.(+)  EMA 13 is at 5366 level
EMA13>EMA39.(+)

Answers for Yesterday
Todays Bearish Signals:
NIL

NIFTY jumped up from 5400 level and closed above it. Can it sustain? It should, if global market favours. Let's see what's in store ahead.

Questions
What is going to happen next? Let's wait and watch.

Wednesday, July 21, 2010

Interpreting Stocks : 21st July 2010

NIFTY EOD Analysis as on 21st July 2010

 Green Candle with *okay* volumes, showing buying pressure. But again, it couldn't close above the 5400 resistance level.

EMA3 is above EMA13 (+).
Slope of EMA 13 is up.(+)  EMA 13 is at 5354 level
EMA13>EMA39.(+)

Answers for Yesterday
Todays Bearish Signals:
1) NIFTY is finding it card to cross above 5400 resistance level inspite of +ve global cues today.
2) MACD and Price -ve divergence.
3) MACD on the verge of giving a sell signal.

Volume was low today at the resistance level. Unless and until, 5400 level is broken with good volumes we need to be cautious.

Questions
What is going to happen next? Let's wait and watch.

Retracement or Reversal?

Market Trends

Market Trends are classified into :

  1. Secular Trend = A secular market trend is a long-term trend that lasts 5 to 25 years and consists of a series of sequential primary trends.
  2. Primary Trend = A primary trend has broad support throughout the entire market (most sectors) and lasts for a year or more. Length of these markets generally last from 1 to 3 years in duration.
  3. Secondary Trend = Secondary trends are short-term changes in price direction within a primary trend. The duration is a few weeks or a few months. This cycle could last as little as two weeks or as long as six to eight weeks.


Source :- http://en.wikipedia.org/wiki/Market_trend

Posted via email from trading-odyssey's posterous

Tuesday, July 20, 2010

Interpreting Stocks : 20th July 2010

NIFTY EOD Analysis as on 20th July 2010

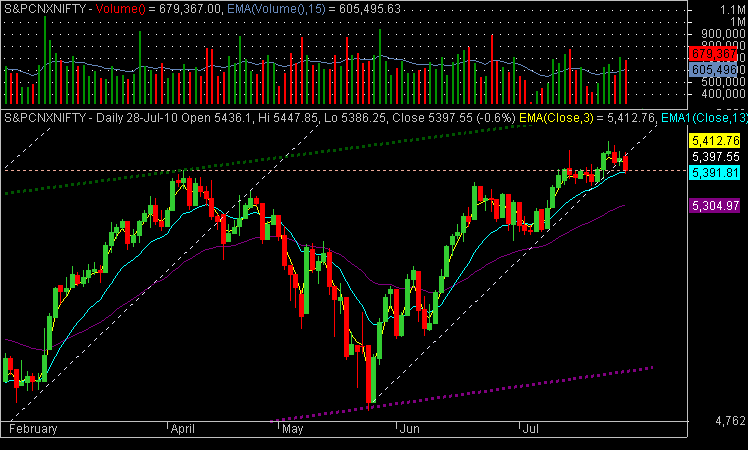
 Red Candle in a rangebound market, with low volumes showing that the supply was less today.
NIFTY is approaching the support level at 5346 level. IF Global Cues favour, we may see a bounce from this level to upside.

EMA3 is above EMA13 (+).
Slope of EMA 13 is up.(+)  EMA 13 is at 5346 level
EMA13>EMA39.(+)

Answers for Yesterday
Todays Bearish Signals:
1) MACD and Price -ve divergence.
2) MACD on the verge of giving a sell signal.

NIFTY is moving in a rangebound market since the past few days and falling downwards.
Supply has been reducing now and NIFTY is approaching the support level at 5346 level. If all favours well, we may see upmove from this level now.
Also, the 5400 level resistance is acting as a barrier to move up. We are really in a tight range now.

Questions
What is going to happen next? Let's wait and watch.

Monday, July 19, 2010

Important Points from Teach a Man to Fish...

1) After an intermediate uptrend, the correction should be only 33-66% of that cycle. (One intermediate cycle = one intermediate uptrend and one intermediate downtrend).
-- Greater the retracement, the increased likelihood that the primary trend has reversed to the down.

2) Substantial increase in volume during the price decline supports the down move.

3) The market moves in trends. We have an uptrend, downtrend and sideways trend.

4) That there are different categories to Trends. We call it Major (when we are talking long term and of the monthly charts), Intermediate (off the weekly), and near term or short term (off the daily).

5) We know that a series of higher highs and lows is termed a rally. That a series of lower lows and highs is termed a decline, that a series of higher pivot lows and highs is called an Uptrend, and a series of lower pivot highs is called a downtrend.

6) Basically, in a nutshell, for starters, keep away from trades where the daily is setting up, and the weekly is still in a downtrend. The desire to predict and get in at lower prices will cost you dear. Get into another stock where we have a weekly in an uptrend, and then buy declines.


Source :- www.traderji.com

Interpreting Stocks : 19th July 2010

NIFTY EOD Analysis as on 19th July 2010

 Red Candle in a rangebound market, with average volumes showing normal selling pressure.

EMA3 is above EMA13 (+).
Slope of EMA 13 is up.(+)  EMA 13 is at 5343 level
EMA13>EMA39.(+)

Answers for Yesterday
Todays Bearish Signals:
1) MACD and Price -ve divergence.

NIFTY is moving in a rangebound market since the past few days. The 5400 level resistance is acting as a barrier to move up.

Questions
What is going to happen next? Let's wait and watch.

Price Pivots

Price pivots are best conceptualized with three bars. A three-bar pivot low represents support and is formed when buying pressure turns price from down to up. It is designated by a price bar with a higher low that closes above the previous bar's high, where the previous bar's low is lower than the bar that preceded it. This is true in every time frame.
Source :- http://www.investopedia.com/articles/trading/07/pivots.asp


In the above image, the low on 13-07-2010 is Pivot Low.


Same concept applies to Pivot High.