Sunday, February 28, 2010
Wednesday, February 24, 2010
Tuesday, February 23, 2010
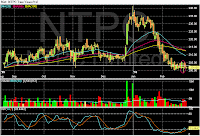
NIFTY EOD Analysis for 23rd Feb 2010
White Spinning-Top Candlestick. But, no significance as there is no clear trend. Showing little buying pressure. Stochastics is flat. %K is kissing %D line. MACD is showing +ve bias. Moving Average 5,15,50 is bearish. EMA 15 support at 4860. EMA 50 resistance at 4960. EMA5 support at 4850.
Monday, February 22, 2010
NIFTY EOD Analysis for 22nd Feb 2010
Black Candlestick. Showing selling pressure. Stochastics is showing -ve bias. %K line cuts %D line, so showing -ve sentiment. MACD is also showing +ve bias. Moving Average 5,15,50 is bearish. EMA 15 resistance at 4870. EMA 50 resistance at 4960. EMA5 support at 4850.
Sunday, February 21, 2010
Saturday, February 20, 2010
Friday, February 19, 2010
NIFTY EOD Analysis for 19th Feb 2010
Black Candlestick. Showing selling pressure. Stochastics is showing -ve bias. MACD is also showing +ve bias. Moving Average 5,15,50 is bearish. EMA 15 support at 4870. EMA 50 resistance at 4969. EMA5 support at 4850.
Thursday, February 18, 2010
NIFTY EOD Analysis for 18th Feb 2010
Black spinning-top Candlestick. Showing selling pressure. Stochastics is showing +ve bias. MACD is also showing +ve bias. Moving Average 5,15,50 is bearish. EMA 15 support at 4870. EMA 50 resistance at 4969. EMA5 support at 4850.
Wednesday, February 17, 2010
NIFTY EOD Analysis for 17th Feb 2010
White Bullish Candlestick. Showing buying pressure. Stochastics is showing +ve bias. MACD is also showing +ve bias. Moving Average 5,15,50 is bearish. EMA 15 support at 4870. EMA 50 resistance at 4969. EMA5 support at 4810.
Tuesday, February 16, 2010
NIFTY EOD Analysis for 16th Feb 2010
White indecisive Candlestick. Showing normal buying pressure. Stochastics is showing +ve bias. MACD is also showing +ve bias. Moving Average 5,15,50 is bearish. EMA 15 resistance at 4870. EMA 50 resistance at 4969. EMA5 support at 4810.
Subscribe to:
Comments (Atom)


